前言
機器學習中都會有一個目標函數(object function)來計算尋找出最佳化模型或優化模型,換句話說也就是該模型希望達到的目的,比如 K-means 群集分析就是希望最小化群內的資料和群心的誤差平方和,而其中 loss function 可以說和目標函數是高度相關,但又不完全相同。
目標函數是在訓練模型中的最終目的,即我們想要最小化獲最大化其值,而 loss function 或 cost function 則為個別數據或整組數據的損失,因為泛化(generalization capability)更為重要,因此有時候有可以最小化 cost function ,但是透過正規
泛化的意思是模型對未來未知 data 的預測能力,而非訓練時的測試集
cost function 可先將其視為 loss function 的平均值
化(regularization)減少過擬合(over fitting)而得到更適合的模型。因此當沒有正規化的麼型,這種情況下目標函數極為成本含數
Loss Function
loss function 可視為是一種在特定 data set 衡量模型預測的預期結果的好壞指標,進而透過該指標再優化或改進模型。這意味著損失函數的選擇很重要,需要特定於我們想要解決的任務 lose function 主要分為兩大類:
- Regression Loss | 回歸主要是預測連續值(continuous value),例如存活年齡,預期房價或是
- Classification Loss | 可以是二元分類,多元分類等等,例如客戶是否購買產品,電影屬於哪種類型
Loss function | 回歸
一般而言在回歸問題中,最常使用的就是 MSE(mean square error) $$ MSE = \dfrac{\sum_{i=1}^n(y_i - \hat{y})^2}{n} $$ 很值觀的, MSE 為實際值和預測值之間的平方差之平均,因為有平方過後而不會有負值,因此方向並沒有差,但因為平方的關係故極端值容易被放大影響最後的 MSE,用 python 也非常容易計算
from sklearn.metrics import mean_squared_error
import numpy as np
y_true = np.random.rand(5)
y_pred = np.random.rand(5)
mean_squared_error(y_true, y_pred)
當然也可以自訂義數學式來計算
import numpy as np

y_true = np.array([0.01, 0.15, 0.28, 0.44])
y_pred = np.array([0.00, 0.12, 0.26, 0.34])

def mse(predictions, targets):
    differences = predictions - targets
    differences_squared = differences ** 2
    mean_of_differences_squared = differences_squared.mean()
    return mean_of_differences_squared
mse_val = mse(y_pred, y_true)
print("rms error is: {}".format(str(mse_val)))
其他類型的 loss function
而如果我們想使用 MAE 最為 XGBoost 的 loss function 會遇到甚麼問題呢 ?
在 XGBoost 這種 GBDT 這類 gradient boosting method 算法中, XGBoost 在訓練決策樹時計算葉片權重會使用到二階導數(second derivative),然而 MAE 因為斜率的不連續性,因此二階導數數值會為 0,鑑於此,可以用其他接近於 MAE 且可以二階導數的函數作為替代。例如 pseudo-huber 或是 fair。
我們先透過自訂義 loss function 來看各種不同樣態的 loss function 的圖形呈現
這邊 a代表
$$
{\sum_{i=1}^n(y_i - \hat{y})}
$$
MSE
$$
L(a) = a^2
$$
MAE $$ L(a) = | a | $$
Fair $$ L_c(a) = c^2(\frac{| a |}{c} - \ln(1+\frac{| a |}{c})) $$
Pseudo-Huber
$$
L_\delta(a) = \delta(\sqrt{ 1 + (\frac{a}{\delta})^2 }-1)
$$
Huber
$$
L_\delta(a) = \begin{cases}
\dfrac{1}{2}a^2 & \quad \text{for} \ | a |\leq\delta\
\delta\cdot(| a |-\dfrac{1}{2}\delta) & \quad \text{otherwise}
\end{cases}
$$
然後用 python 來實現各 loss function 的 圖形分布
def losses(x, d = 1, c = 1):
    # MAE
    mae = np.abs(x)

    # MSE
    mse = x ** 2

    # huber loss
    d = np.repeat(d, x.shape[0])
    huber = np.zeros(x.shape[0])
    less = (np.abs(x) <= d)
    more = ~less
    huber[less] = 0.5 * x[less] ** 2
    huber[more] = d[more] * (np.abs(x[more]) - 0.5 * d[more])

    # pseudo-huber
    scale = 1 + (x/d) ** 2
    p_huber = (d ** 2) * (np.sqrt(scale) - 1)

    # fair
    c = np.repeat(c, x.shape[0])
    abs_x = np.abs(x)
    fair = (c ** 2) * (abs_x / c - np.log(1 + (abs_x / c)))

    return mae, mse, huber, p_huber, fair


x = np.linspace(-5, 5)
mae, mse, huber_d1, p_huber, fair = losses(x)
_, _, huber_d4, _, _ = losses(x, d = 4)

fig, ax = plt.subplots(1, 1, figsize = (5, 5))
ax.plot(x, mae, '--', label = 'mean absolute error', alpha = 0.5)
ax.plot(x, mse, '--', label = 'mean squared error', alpha = 0.5)
ax.plot(x, huber_d1, '--', label = 'huber, d=1', alpha = 0.5)
ax.plot(x, huber_d4, '--', label = 'huber, d=4', alpha = 0.5)
ax.plot(x, p_huber, '--', label = 'p_huber, d=1', alpha = 0.5)
ax.plot(x, fair, '--', label = 'fair, c=1', alpha = 0.5)
ax.set_title("Common Loss Functions for Regression Problems")
ax.legend();
ax.legend();
plt.show()
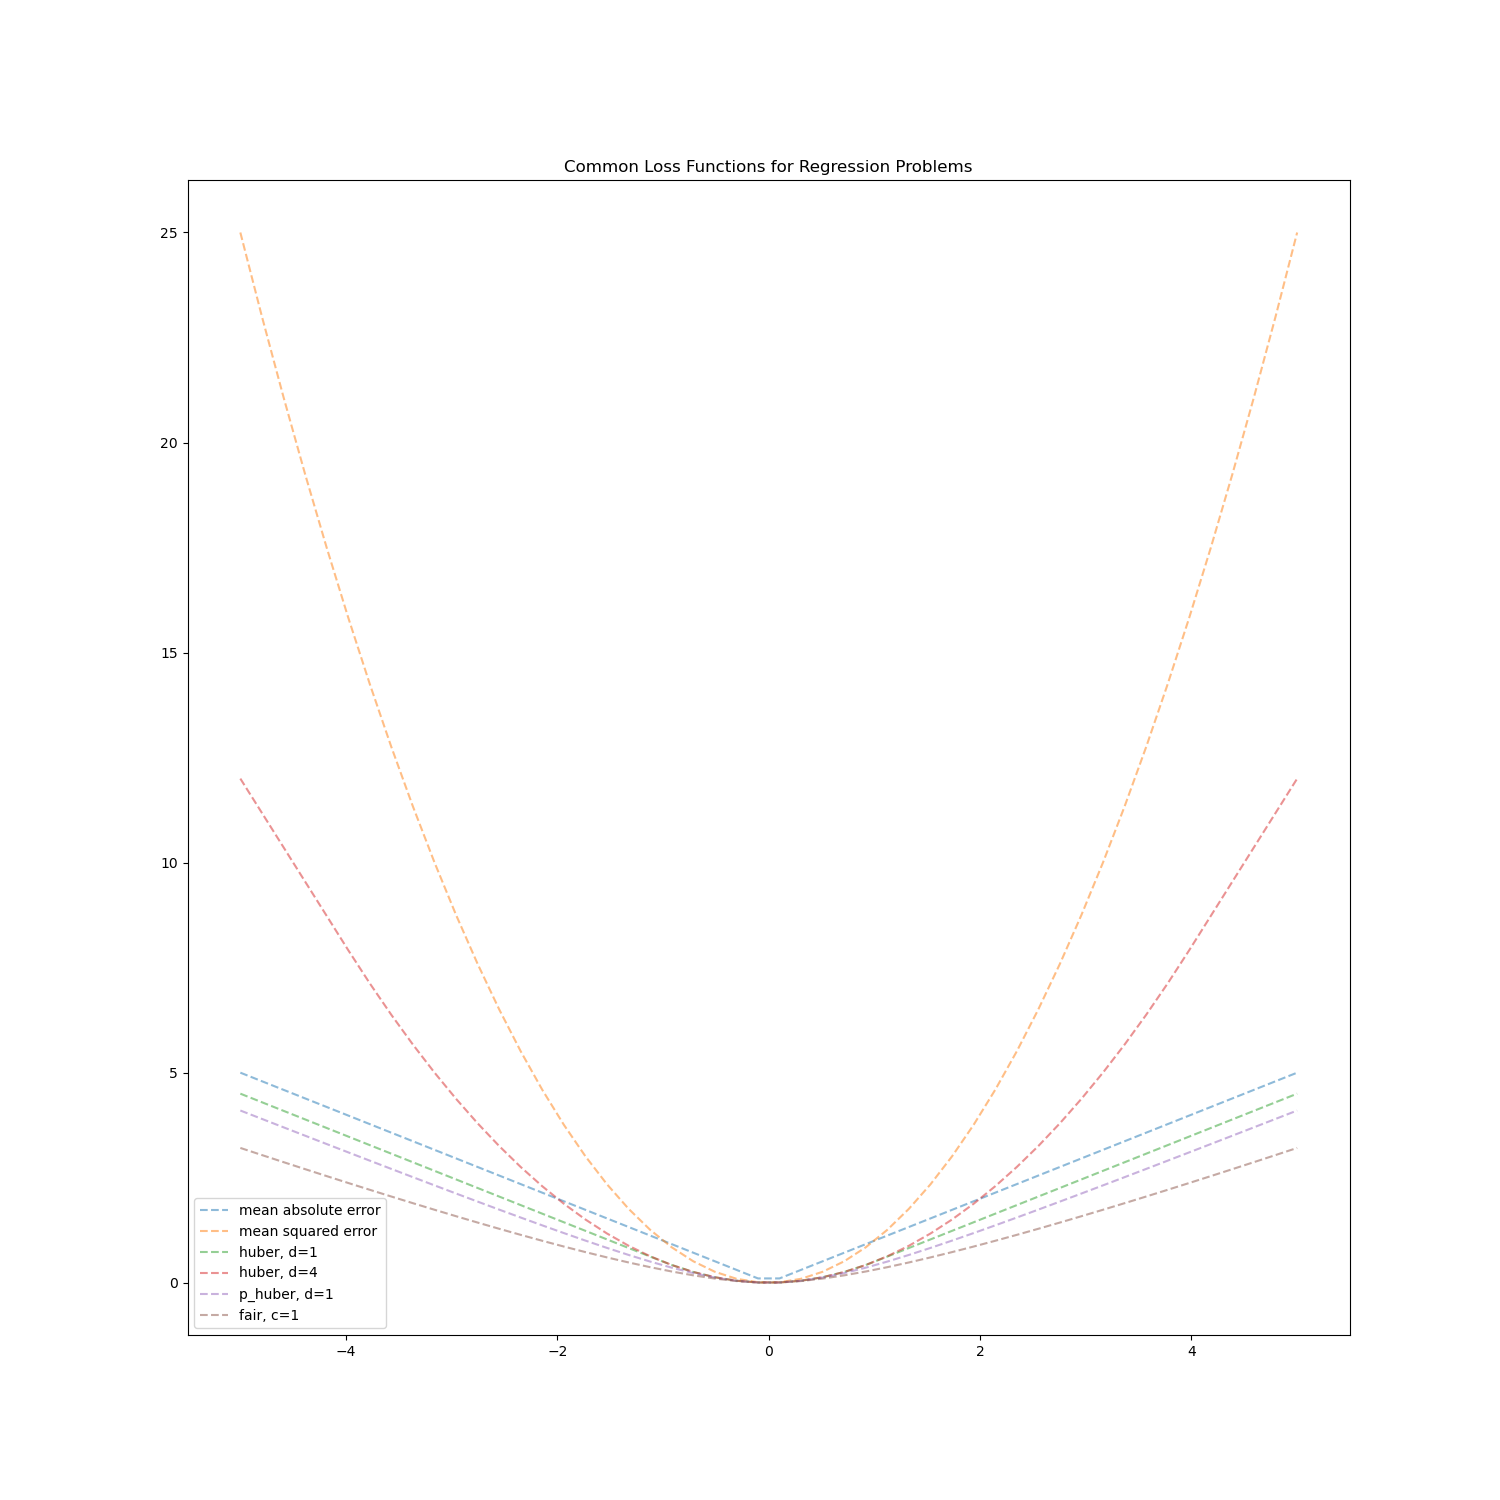
可以看的出來當 a 越大時,MSE 的 loss 會增加得非常陡峭,故可以使用其他的 loss function 來替代 MSE,會有較接近於 MAE 的平滑曲線,但相較於 fair 和 pseudo-huber ,huber 函數相對直覺,定義好 $ \delta $ 作為 threshold,分別為 MAE 和 MSE。而 fair pseudo-huber 數學式相對複雜,比較像是 black box 不好解釋,但其也能作為 XGBoost 的 loss function。
自訂義 loss function
以下示範自訂義 loss function 並代入一階導數和二階導數到 XGBoost 的模型內
第一次先使用 XGBoost 中 default 設定的 argument ,RMSE 來訓練模型。
這邊資料是使用 kaggle 比賽的 dataset,data 網址如下:
- 首先先將資料做簡單的預處理,這邊大致上就是將日期拆分為 year、month、date 和 time
import calendar
import os
print(os.path.abspath(os.getcwd()))
print(os.listdir("./data"))

df = pd.read_csv('data/bike_sharing_demand_train.csv')
df.head()

def preprocessing(df):
    columns = ['datetime', 'season', 'holiday', 'workingday', 'weather', 'temp',
       'atemp', 'humidity', 'windspeed', 'casual', 'registered']

    X_train,  X_test, y_train, y_test = train_test_split(df[columns], df['count'],
                                                         test_size = 0.2, shuffle = True, random_state = 22)
    print('train_data_shape: X - {}, y - {}'.format(X_train.shape, y_train.shape))
    print('test_data_shape: X - {}, y - {}'.format(X_test.shape, y_test.shape))

    # transfer the datatime to year month day and time
    year = []
    month = []
    day = []
    time = []
    for i in range(len(X_train)):
        year.append(int(X_train["datetime"].values[i].split()[0].split("-")[0]))
        month.append(int(X_train["datetime"].values[i].split()[0].split("-")[1]))
        day.append(int(X_train["datetime"].values[i].split()[0].split("-")[2]))
        time.append(int(X_train["datetime"].values[i].split()[1].split(":")[0]))

    X_train["year"] = year
    X_train["month"] = month
    X_train["day"] = day
    X_train["time"] = time

    year = []
    month = []
    day = []
    time = []
    for i in range(len(X_test)):
        year.append(int(X_test["datetime"].values[i].split()[0].split("-")[0]))
        month.append(int(X_test["datetime"].values[i].split()[0].split("-")[1]))
        day.append(int(X_test["datetime"].values[i].split()[0].split("-")[2]))
        time.append(int(X_test["datetime"].values[i].split()[1].split(":")[0]))

    X_test["year"] = year
    X_test["month"] = month
    X_test["day"] = day
    X_test["time"] = time

    train_colunms = ['year', 'month', 'day', 'time','season', 'holiday', 'workingday', 'weather', 'temp',
       'atemp', 'humidity', 'windspeed', 'casual', 'registered']

    X_train = X_train[train_colunms]
    X_test = X_test[train_colunms]

    return  X_train,  X_test, y_train, y_test


X_train,  X_test, y_train, y_test = preprocessing(df)
然後在 define XGBoost model
def xgb_model(X_train, y_train, X_test, y_test,
              objective='reg:squarederror',
              learning_rate=0.3,
              min_child_weight=1,
              lambda_=1,
              gamma=0):
    # Initialize XGB with objective function
    parameters = {"objective": objective,
                  "n_estimators": 100,
                  "eta": learning_rate,
                  "lambda": lambda_,
                  "gamma": gamma,
                  "max_depth": None,
                  "min_child_weight": min_child_weight,
                  "verbosity": 0}

    model = xgb.XGBRegressor(**parameters)
    model.fit(X_train, y_train)

    # generate predictions
    y_pred_train = model.predict(X_train).reshape(-1, 1)
    y_pred = model.predict(X_test).reshape(-1, 1)

    # calculate errors
    rmse_train = mean_squared_error(y_pred_train, y_train, squared = False)
    rmse_val = mean_squared_error(y_pred, y_test, squared = False)
    print(f"rmse training: {rmse_train:.3f}\t rmse validation: {rmse_val:.3f}")

    # plot results
    y_train = np.array(y_train).reshape(-1, 1)
    y_test = np.array(y_test).reshape(-1, 1)

    fig, axes = plt.subplots(1, 2, figsize=(15, 5))
    axes[0].scatter(y_pred_train, y_train, alpha=0.5, s=5)
    axes[0].set_xlabel('predicted values')
    axes[0].set_ylabel('true values')
    axes[0].set_title(f"Training, rmse: {rmse_train:.3f}")
    axes[1].scatter(y_pred, y_test, alpha=0.5, s=5)
    axes[1].set_xlabel('predicted values')
    axes[1].set_ylabel('true values')
    axes[1].set_title(f"Validation, rmse: {rmse_val:.3f}");
	plt.show()

    fig, axes = plt.subplots(1, 2, figsize=(15, 5))
    frequency, bins = np.histogram(y_train, bins=50, range=[np.min(y_pred_train), np.max(y_pred_train)])
    axes[0].hist(y_train, alpha=0.5, bins=bins, density='true', label="train")
    axes[0].hist(y_pred_train, alpha=0.5, bins=bins, density='true', label="predictions")
    axes[0].legend()
    axes[1].hist(y_test, alpha=0.5, bins=bins, density='true', label="validation")
    axes[1].hist(y_pred, alpha=0.5, bins=bins, density='true', label="prediction")
    axes[1].legend();
    plt.show()
    return y_pred_train, y_pred
y_pred_train_mse, y_pred_mse = xgb_model(X_train, y_train, X_test, y_test, objective = 'reg:squarederror')
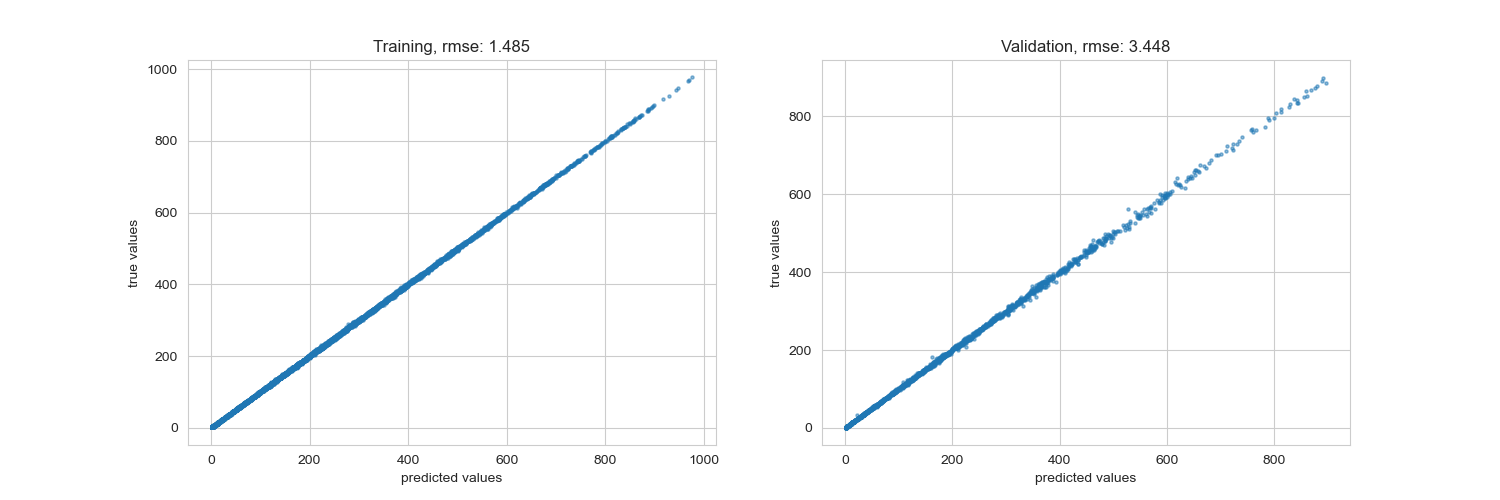
rmse training: 1.485 rmse validation: 3.448
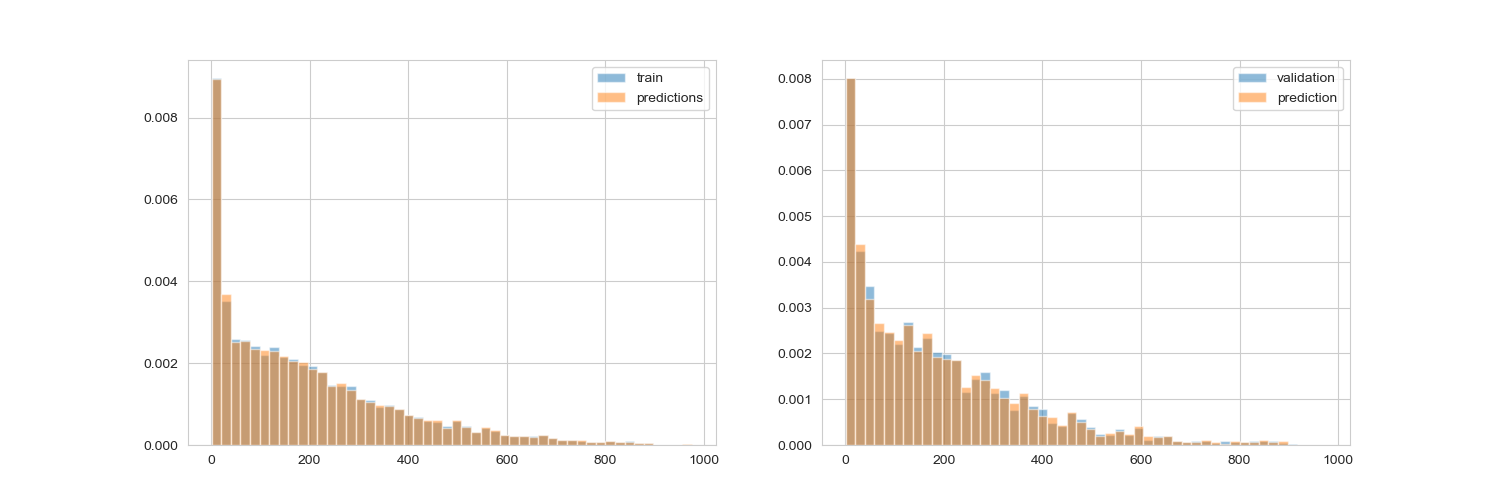
以下結果為使用 XGBoost 的 default loss function RMSE 的結果,可以看的出來不管是在 train set 或是 test set 都擬合得很好
接著我們來自定義 loss function,使用 fair 作為示範,在使用自訂義 loss function 導入 XGBoost 的 model 時,要返回一階和二階倒數的值,部分數學會使用到偏微分這邊就略過不提。
def fair(y_pred, y_val):
    x = (y_val - y_pred)  # 求得殘差
    c = 0.5  # Fair 函數的參數
    den = abs(x) + c  # 計算斜率公式的分母
    grad = c * x / den  # 斜率
    hess = c * c / den ** 2  # 二階微分値
    return grad, hess
這裡的 grad 和 hess 就是分別對 fair 函式做一階和二階導數
y_pred_train_f, y_pred_f = xgb_model(X_train, y_train, X_test, y_test, objective = fair, learning_rate = 0.1)
rmse training: 11.248 rmse validation: 10.212
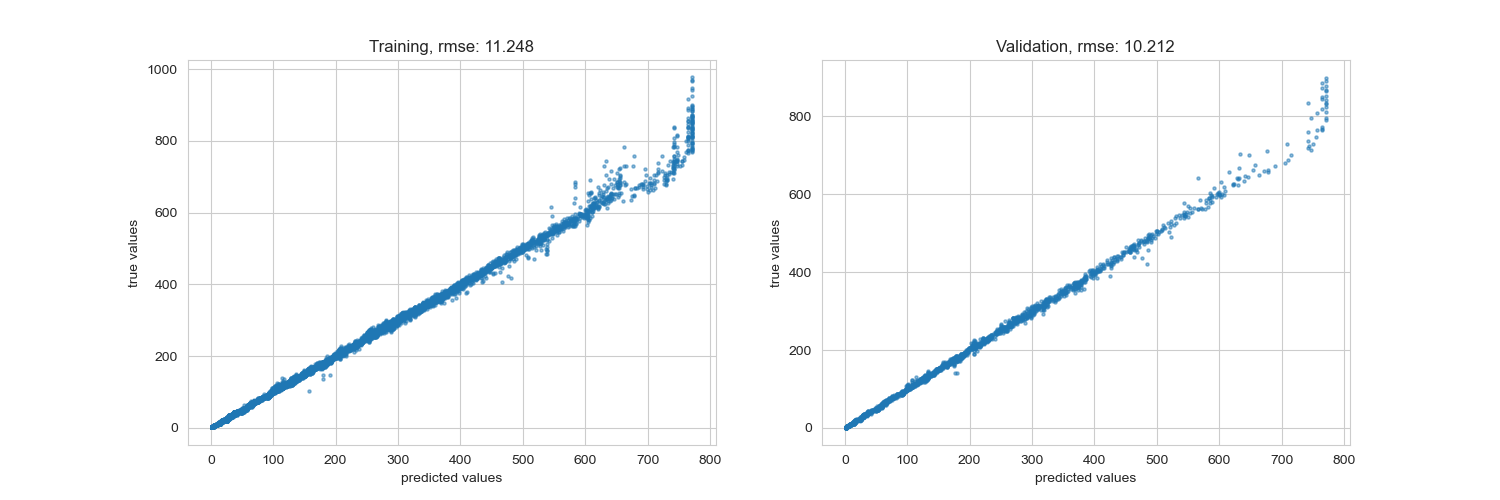
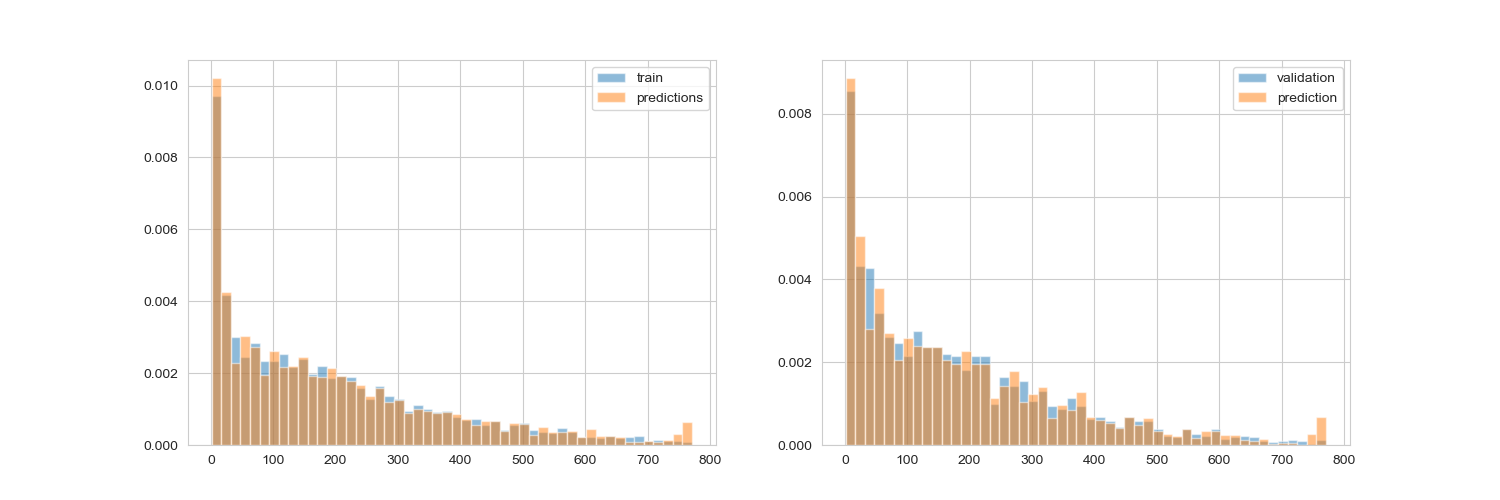
其實可以從圖表中看的出來 RMSE 的表現非常好,而我們自製的 loss function 反而在某些數值中跑掉了,因為這種型態的 loss function 會對於極值做出懲罰,因此還是要取決於你的資料型態,因此前期的資料探索就非常重要,如果資料遇到了不平衡,或式分類上有極端的狀況,都可以試看看調整損失函數。
不過 RMSE 表現良好的情況下,自訂 loss function 你需要通盤了解整個 data set 的狀況,不然這些 black box 的損失函數會對你的模型表現造成傷害。
Referance
Common Loss functions in machine learning
Understanding the 3 most common loss functions for Machine Learning Regression